October 11, 2026
WBGT for Schools: How to Use Wet Bulb Globe Temperature to Make Practice Calls
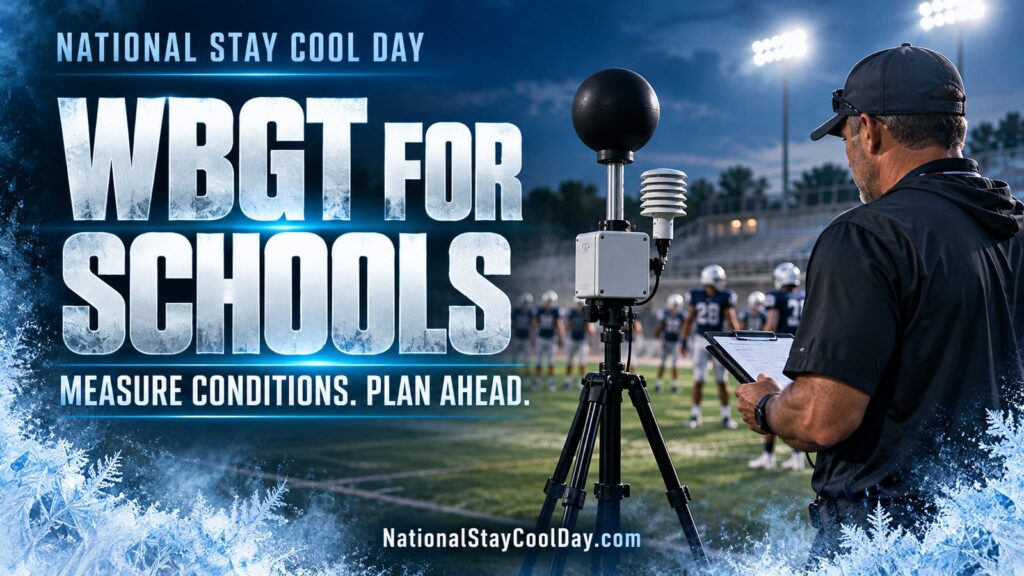
The thermometer on the press box tells you the air temperature in the shade. Your athletes are not standing in the shade. They are on turf or grass in full sun, in humid air, sometimes in helmets and pads, working hard. That gap is why athletic trainers and state associations use wet bulb globe temperature (WBGT) to decide whether practice runs as planned, gets modified, or moves indoors.
This guide explains what WBGT measures, how it differs from the heat index, how to take a reading that means something, and how to turn it into rules your staff can follow without a debate on the sideline.
What WBGT Measures
WBGT estimates heat stress on a person in direct sunlight. The National Weather Service describes it as a combination of three readings:
- Wet bulb: a thermometer covered in a wet cloth. Evaporation cools it, the same way sweat cools an athlete. High humidity slows evaporation, so the wet bulb reads higher.
- Black globe: a dark globe that heats up in the sun and cools in the wind. It captures solar radiation and air movement.
- Dry bulb: ordinary air temperature measured in the shade.
Put together, those readings account for temperature, humidity, wind and sun. Humidity matters more than most people think. Evaporating sweat is the body’s most efficient way to shed heat, and humid air slows evaporation, which is why the wet bulb reading is part of the number.
WBGT vs. Heat Index
| WBGT | Heat index | |
|---|---|---|
| Measured or estimated for | Direct sunlight | Shade |
| Accounts for sun | Yes | No |
| Accounts for wind | Yes | No |
| Accounts for humidity | Yes | Yes |
| Who uses it | Athletic trainers, military, OSHA, marathon organizers | General public weather forecasts |
| Best use for sports | Practice and game decisions on site | Use only if your state association requires it |
The heat index is a shade number. It leaves out the sun beating down on a field. The two numbers also run on different scales, so a WBGT of 88°F and a heat index of 88°F are not the same conditions. Never plug one into a chart built for the other.
The Same Number Means Different Things in Different Places
Athletes adapt to the climate they train in. A WBGT reading that is a routine August afternoon in south Georgia is an unusual, dangerous day for a team in Minnesota or Oregon.
Research backs this up. A study of Georgia high school football players, published in the International Journal of Biometeorology in 2020, found that about 68% of practices in the cooler northern part of the state took place below a WBGT of 82°F, while southern teams spent far more time in hotter categories. After acclimatization, northern athletes had significantly higher heat illness rates, even after controlling for weather. The authors concluded that differences in acclimatization were driving the gap.
Humidity matters too. A 2020 study in the Journal of Athletic Training that used 15 years of hourly data from 217 U.S. weather stations found that athletes lose heat more easily in hot, dry conditions than in warm, humid ones at the same WBGT. Dry conditions dominate the western half of the country and humid conditions dominate the east.
The National Athletic Trainers’ Association position statement on exertional heat illnesses says heat guidelines should be region specific. The practical rule for a school is simple: use the WBGT chart your state association publishes for your region, and confirm it with your medical team.
What a WBGT Chart Looks Like
Most charts sort readings into levels, and each level comes with limits on practice length, equipment and rest breaks. The example below appears in the NATA position statement. It originates from the Georgia High School Association and, as NATA notes, applies only to athletes who train in similar conditions. It shows the structure, not the numbers your school should use.
| WBGT reading | Activity and rest breaks (Georgia example) |
|---|---|
| Under 82.0°F | Normal activity. At least 3 rest breaks per hour, at least 3 minutes each. |
| 82.0 to 86.9°F | Use discretion for intense or prolonged exercise. Watch at-risk players closely. At least 3 rest breaks per hour, at least 4 minutes each. |
| 87.0 to 89.9°F | Practice limited to 2 hours. Football players limited to helmet, shoulder pads and shorts; all protective equipment off for conditioning. At least 4 rest breaks per hour, at least 4 minutes each. |
| 90.0 to 92.0°F | Practice limited to 1 hour. No protective equipment and no conditioning. 20 minutes of rest breaks during the hour. |
| Over 92.1°F | No outdoor workouts. Delay practice until a cooler reading. |
The same example spells out what rest breaks mean: unlimited water or electrolyte drinks, no activity, helmets off for football, and a shaded “cooling zone.” Above a WBGT of 86°F, it calls for ice towels and spray bottles at the cooling zone and cold-water immersion tubs available at practice.
How to Take a Reading That Counts
- Measure on site. Take the reading at the field or venue where athletes are actually working, in the same sun and on the same surface. A reading from the parking lot or a weather station across town does not tell you what the field feels like. A 2017 study in the Journal of Athletic Training compared on-site readings on 10 athletic surfaces with National Weather Service estimates and found the estimate put teams in the wrong activity category 45% of the time. The authors recommend a reading from each playing surface.
- Measure before activity starts. The decision about practice length and equipment happens before the first drill, not halfway through.
- Keep measuring. Conditions change as the sun moves and the wind drops. Some state associations, including Georgia, Texas and Iowa, require a reading before practice and every 30 minutes during it. Follow your state’s rule.
- Write it down. Record the time, the reading and the level. A log shows your staff followed the policy and helps you spot patterns over a season.
- Name the person responsible. One person checks, one person has the authority to change practice, and the coaching staff knows both names before the season starts.
Phone apps are not a substitute for an on-site device
A 2025 study in GeoHealth collected 1,056 paired readings at 26 high schools in 11 states, comparing a phone app’s WBGT estimates with on-site measurement devices. The app ran about 1°C (roughly 2°F) cooler on average and 2 to 3°C cooler on the hottest days. It also placed teams in a lower activity category more often than the on-site device did, especially in hotter conditions. Readings on grass and artificial turf showed the same pattern. The authors concluded the app needs more validation before it replaces on-site measurement.
Use forecasts and apps to plan. Use an on-site reading to decide.
Plan with the forecast
The National Weather Service publishes experimental WBGT forecasts by region up to 7 days ahead. Check the forecast on Sunday night, and move practices earlier or later in the day before a hot week starts instead of scrambling at 3 p.m. The CDC’s guidance for athletes gives the same advice: schedule workouts earlier or later in the day when it is cooler, and limit activity in the middle of the day.
Yesterday’s Heat Counts Too
The NATA position statement identifies a high WBGT on the previous day as one of the best predictors of exertional heat illness. Heat stress adds up. An athlete who practiced in heavy heat yesterday and slept in a hot room is carrying that into today’s session. When you plan back-to-back days in a heat wave, lighten the second day.
What a Number Cannot Do
WBGT is a planning and decision tool. It does not rule out heat stroke. NATA is clear that exertional heat illness occurs in conditions that look normal, especially during the first week of practice when athletes are not yet acclimatized. A low reading is not a reason to drop your guard or put the tub away. Here is why every practice and event needs a cold-water immersion tub on site.
If an athlete collapses or starts acting confused, the response is the same at any WBGT: cool first, transport second. Call 911 and start cooling on site at the same time. Start cooling within 10 minutes of collapse and cool to about 102°F within 30 minutes, then transport. Cold-water immersion with ice agitation is the gold standard. Remove anything you can quickly, but don’t delay cooling because of gear removal. Exertional heat stroke is one of the most survivable emergencies in sports when a school follows that order. Our guide to cold water immersion for heat stroke in schools covers setup and the full response protocol.
Turn Your Chart Into a Card
A policy in a binder does not help the assistant coach running practice on a Tuesday. The free Heat Rules Card puts your rules on one laminated page at the field:
- Pick your state and venue. Make one card for each venue.
- Enter who checks heat conditions and when, following your state association’s rule.
- Fill in the reading where each of your five heat levels begins, taken from your state association’s chart and confirmed with your medical team. The tool leaves every number blank on purpose so your card matches your region.
- Add the street address for 911 callers, the ambulance gate, the cold-water immersion tub location, the AED location and the names and phone numbers of the person in charge and the athletic trainer.
- Have your team physician or medical director approve it, then print, laminate and post it where staff check the heat.
Everything you type stays in your browser. Nothing is sent to National Stay Cool Day. Pair the card with the free Acclimatization Schedule for the first two weeks of any season and the Emergency Action Plan Builder for your venue’s response plan. All three are on our free heat safety tools page.
Frequently Asked Questions
What is a safe WBGT for practice?
There is no single national number. Safe limits depend on your region and how acclimatized your athletes are. Use your state association’s chart. In the Georgia example above, normal activity with regular rest breaks applies below 82°F, and outdoor workouts stop above 92.1°F.
Is WBGT the same as the heat index?
No. The heat index is calculated for shade and uses temperature and humidity. WBGT adds sun and wind. The scales differ, so never use a heat index number on a WBGT chart.
How often should we check WBGT?
Before every practice and game, and during activity. Several state associations require a reading every 30 minutes during practice. Your state’s rule sets the minimum.
Can we use a free phone app instead of a WBGT device?
Use apps for planning, not for the go or no-go call. A 2025 multistate study found a phone app read cooler than on-site devices and underestimated the activity level, most of all on the hottest days.
Who should take the reading?
The athletic trainer, whenever one is on site. If your school does not have one at every practice, train a designated coach on the device and name that person on your Heat Rules Card.
Does a low WBGT mean heat stroke cannot happen?
No. Exertional heat stroke happens in moderate conditions too, especially early in a season. Keep your cooling tub set up and your emergency plan ready at every practice.
Get Your School Ready Before Spring
Spring sports start in cooler weather, and the first hot days arrive before athletes have adapted. National Stay Cool Day is April 8, 2027. Make your Heat Rules Card now, then sign your school up to take part. It is free.
References
- National Weather Service. Wet Bulb Globe Temperature: How and when to use it. weather.gov/news/211009-WBGT
- National Athletic Trainers’ Association. Position Statement: Exertional Heat Illnesses. Journal of Athletic Training. 2015;50(9):986-1000. pmc.ncbi.nlm.nih.gov/articles/PMC4639891
- Regional differences in exertional heat illness rates among Georgia USA high school football players. International Journal of Biometeorology. 2020;64(4):643-650. doi.org/10.1007/s00484-019-01853-4
- Variations in athlete heat-loss potential between hot-dry and warm-humid environments at equivalent wet-bulb globe temperature thresholds. Journal of Athletic Training. 2020;55(11):1190-1198. pmc.ncbi.nlm.nih.gov/articles/PMC7709211
- Evaluating heat risk: comparing on-site WBGT measurements versus smartphone application estimates. GeoHealth. 2025;9(3):e2025GH001347. pmc.ncbi.nlm.nih.gov/articles/PMC11934076
- The heat strain of various athletic surfaces: a comparison between observed and modeled wet-bulb globe temperatures. Journal of Athletic Training. 2017;52(11):1056-1064. pmc.ncbi.nlm.nih.gov/articles/PMC5737042
- Centers for Disease Control and Prevention. Heat and Athletes. cdc.gov/heat-health/risk-factors/heat-and-athletes.html
This article is for education and planning. It does not replace medical advice. Review all medical steps with your team physician or medical director. In an emergency, call 911.